

|
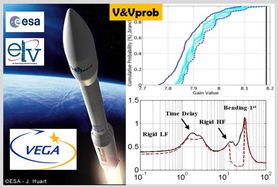
V&VprobV&Vprob stands for "Analytic Stochastic & Time Varying mu Analysis for the VEGA GNC" and is an ESA-ESTEC funded project with the objectives to:
|
Phase I
|
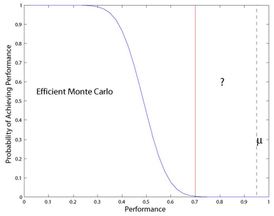
The Monte Carlo (MC) method is the de facto industrial standard for verification and validation (V&V) processes. It is a very simple indirect simulation-based approach where no analytical representation of the system is really needed or used since the approach performs statistical modeling (i.e. find mean and variance of output) based on random sampling of the inputs to the system. In essence, it empirically estimates the probability distribution that a given requirement satisfies a specific threshold given probability distributions on the parameters. The literature on Monte Carlo is very extensive since various sampling techniques have been developed depending on the specific area of application.
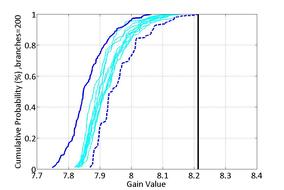
One of the greatest advantages of MC, besides not requiring specific analytical models, is that the accuracy of the estimates does not depend on the dimension of the parameter space but rather on the number of simulations, which depends on the specified requirements for probability, confidence level and accuracy –i.e. by application of Chernoff/Hoeffding bounds and the Sampling Theorem. On the other hand, its shortcomings are related to: the intensive computational effort, being questionable for maximum/minimum values analysis, and that it is a “soft” bound. The latter means that instead of stating that a requirement is satisfied with a specific probability, i.e. a hard-bound, MC qualifies that that probability is achieved within a specified accuracy and a specified confidence probability. In other words, if you run several MC campaigns each will provide a slightly different answer. Thus, it is not only important to run a sufficient number of simulations per campaign but also to perform a sufficient number of MC campaigns. Finally, for rare-events (such as worst-cases) the Monte Carlo method will require prohibitively large number of simulations. Thus, as visually presented in the top figure on the left, Monte Carlo methods are appropriate for approximating the left part of the curve. As a complement to MC, the robust control community has been developing for the last 30 years approaches that provide different and complementary answers to those from Monte Carlo, i.e. the right most dashed line in the top figure on the left. Knowing that in general the exact computation of the robust stability and performance of a system is intractable due to the exponential growth with the number of parameters, the focus shifted to computing hard-bounds on the objectives. Although for some cases the gap between these bounds might be large it is now accepted after many practical studies that for most systems the gap is acceptably close to provide a robust assessment after refining the bounds using branch and bounds algorithms. Thus, deterministic mu is nowadays very well established in the control analysis community due to its proven capability to perform robust stability and performance analysis for uncertain systems. Nevertheless, a common criticism for its use in clearance and certification processes is the lack of quantitative measures on the likelihood occurrence for the identified worst-cases. In addressing this shortcoming, probabilistic mu appeared in the early 1990s but due to the complexity of its calculation it is only recently that toolboxes have started to appear and be used. Probabilistic mu provides a measure of rare events to the worst-case by providing upper and lower bounds on the cumulative distribution function of the worst-case gain, see second plot on the left. In the first phase of the project a linear fractional transformation (LFT) model was developed for the VEGA during atmospheric flight accounting for the main uncertainties, and subsequently it was used to apply deterministic mu and probabilistic mu robust analysis tools in order to assess the state-of-art of the latter. |
Phase II
|
The first objective of the phase II is to extent the preliminary results from phase I to the recently flown VEGA VV05 mission. This new trajectory and controller.data provides a more comprehensive characterization of VEGA, in terms of number of frozen-time points used for the launcher and controller scheduling gains, which should provide a better LPV/LFT modelling.
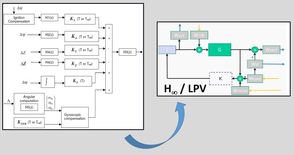
The second objective of phase II is to demonstrate a potential way for the VEGA controller evolution. This will be achieved by designing and comparing to the classical VEGA controller:
|